| Magnetogram Chromosphere Observed from Kitt-Peak Solar Observatory |
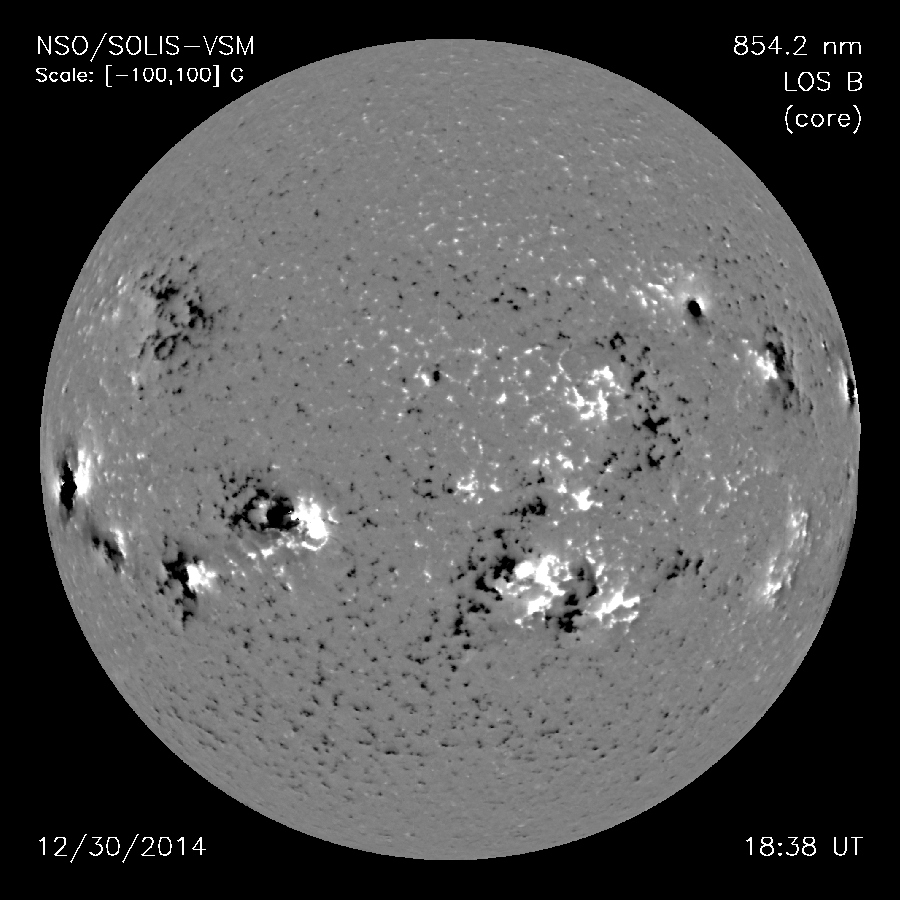 |
A solar magnetogram is a pictorial representation of the spatial variations in strength
of the solar magnetic field. Magnetograms are often produced by exploiting the Zeeman
effect (or, in some cases, the Hanle effect), which George Ellery Hale employed in
the first demonstration that sunspots were magnetic in origin, in 1908. Solar magnetograms
are produced by suitably instrumented telescopes referred to as magnetographs. Some
magnetographs can only measure the component of the magnetic field along the line
of sight from the observer to the source (the field's "longitudinal" component). One
example of such a "line-of-sight" or "longitudinal" magnetograph is the Michelson
Doppler Imager (MDI), a scientific instrument that takes magnetograms of the Sun in
order to measure velocity and magnetic fields in the Sun's photosphere to learn about
the convection zone and about the magnetic fields which control the structure of the
solar corona. A vector magnetograph also measures the component of the magnetic field
perpendicular to the line of sight (the field's "transverse" component), from which
all three components of the magnetic field vector can be deduced. Two examples include
the National Solar Observatory's SOLIS instrument and the Helioseismic and Magnetic
Imager aboard NASA's Solar Dynamics Observatory satellite. |
|