 |
The decision to publish this volume of Solar Activity Maps (d2) in the Annuals of
the International Geophyical Year was taken during the Fifth Meeting of the Special
Commitee of Annual Geophysical International (CSAGI) held in Moscow, 30 July - 9 August
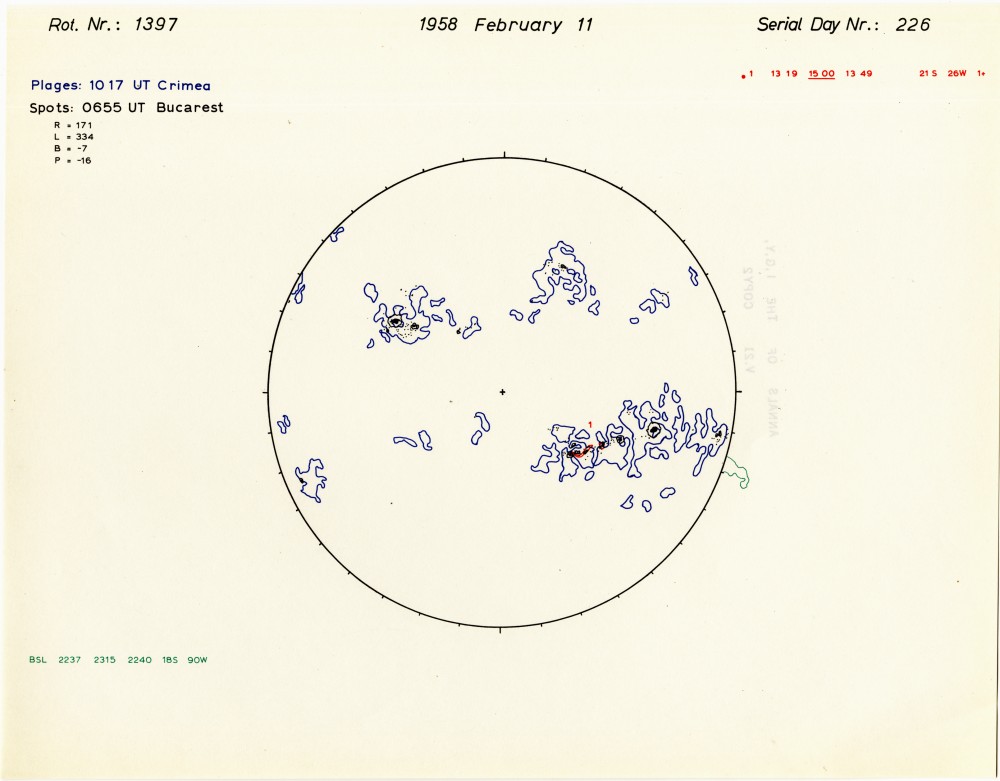
1958. The D-I series of I.G.Y. solar maps is a set of sketches, one for each day,
of the following solar phnomena: sunspots, Bares, calcium plages, surges, and active
prominences. Tracings are also given of the sequence of the development of some well-observed
flares and prominence events.This documentation of the history of 1 1/2 years of solar
activity during the I.G.Y. was made possible by the splendid cooperation of sixty
observing stations throughout the world. Sunspots were traced from white-light drawings.
The outlines of calcium plages were traced principally from spectroheliograms made
in the calcium K line. A list of flare events was made with the importance I+ and
greater, on the basis of all available observations. The I.G.Y. marked the first time
that an attempt was made to assemble, systematically, reports of surges and active
prominences from a number of world-wide observatories. |